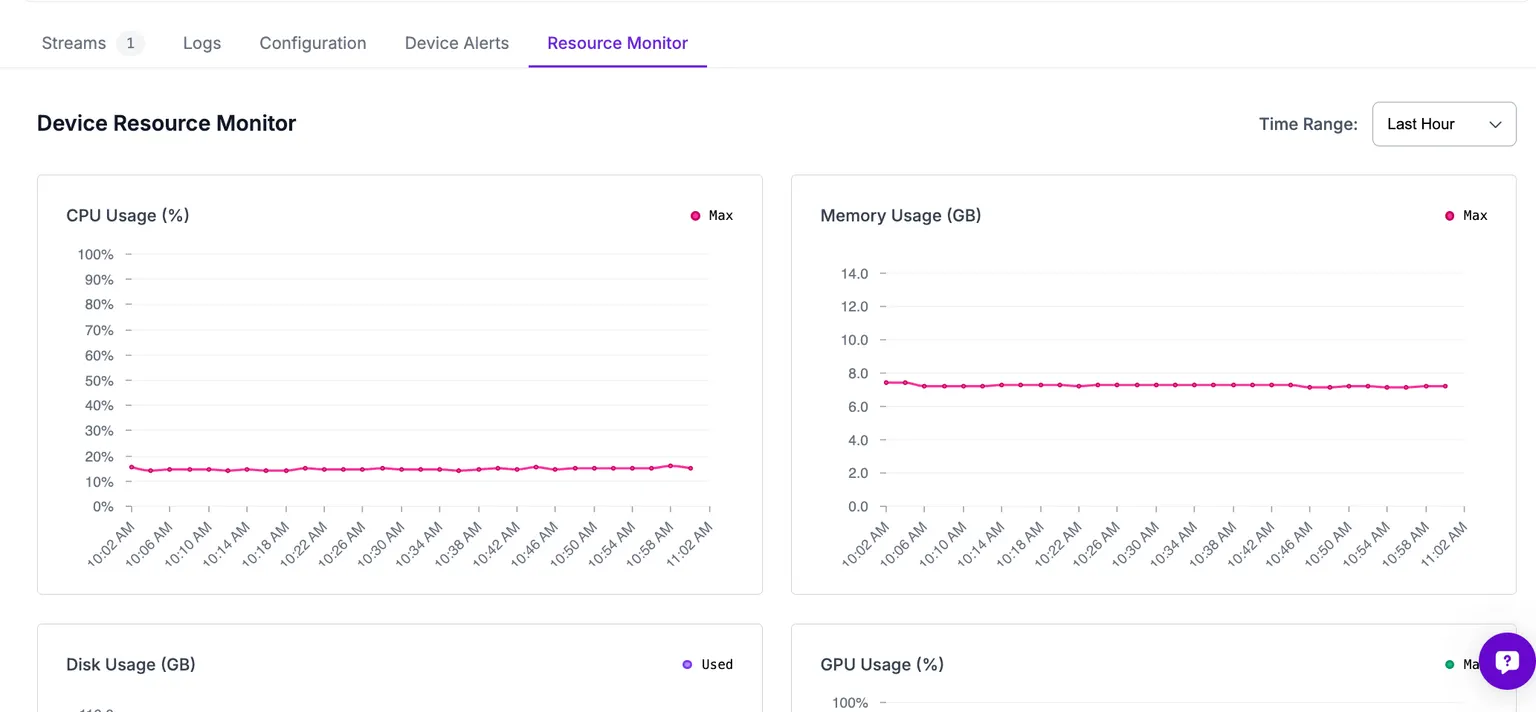
Roboflow Deployment Manager enables you to monitor the health of your device at a system level in cases where you think it may not be operating at an optimal level. You can monitor ongoing disk usage, memory usage, CPU usage, and GPU usage.
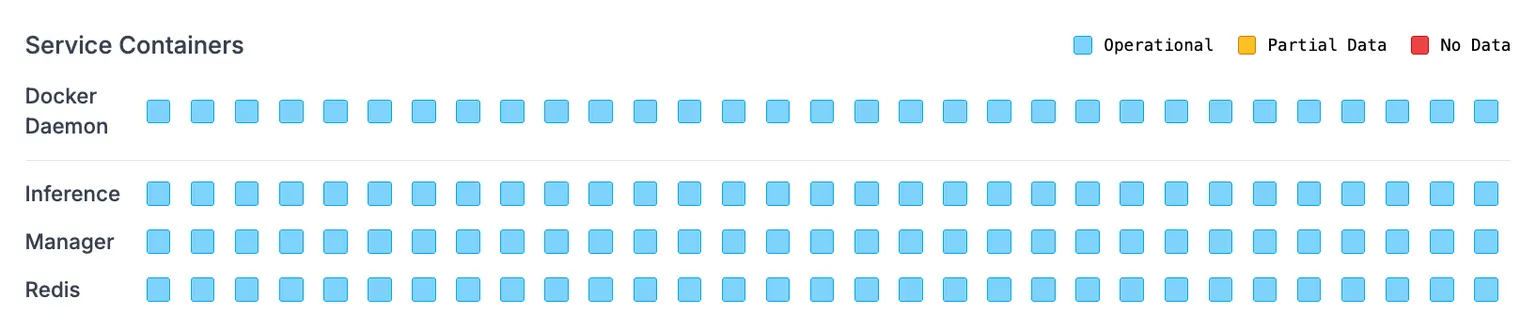
You can also monitor the state of the various services needed for Roboflow to run effectively on your device in the "Service Containers" section.
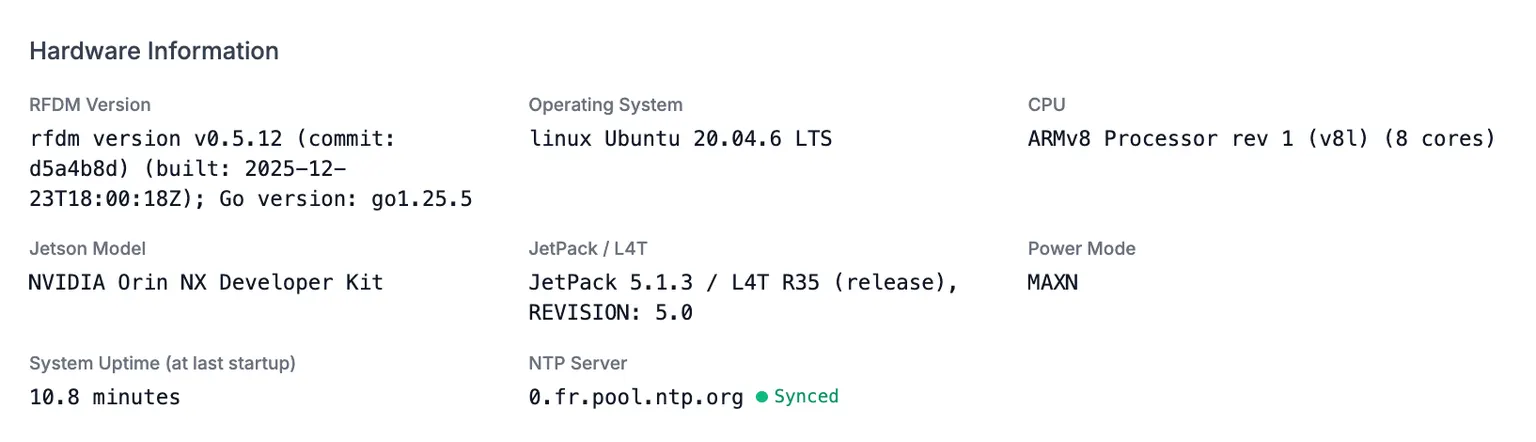
Finally, you can also review static information about your device. This is most useful to help debug if incompatible versions of key dependencies are on the device or if Deployment Manager was unintentionally deployed onto the wrong device.
Stream FPS
The "Inference FPS" and "Camera FPS" charts plot frame rates over the selected time window, with one line per stream running on the device. Use them to find streams that slow down or drop frames over time. The Streams table shows a matching last-hour sparkline next to each stream's FPS value.
Roboflow samples FPS about once a minute per device. There is no backfill, so the charts fill in as new samples arrive.
Docker Storage
The "Docker Storage" panel shows what Docker is using on the device, broken into containers, images, and totals for images, containers, volumes, and build cache. Use it to find what to clear when a device runs low on disk.
The "On disk" size for an image counts only the layers that image does not share with another image, so it is the space you get back by deleting it. Images built on a common base (ex: CUDA, PyTorch) share that base, which is counted once and shown in "Totals" as "shared base" instead of against any single image. "Reclaimable" is the space freed by removing images and volumes nothing is using.
Network Interfaces
The "Network Interfaces" panel (collapsed by default) lists the device's network interfaces with name, type, status, IP addresses, MAC address, and traffic counters. The interface holding an IP address and passing traffic is your uplink. The status chip reflects whether the interface is enabled, not whether a cable is connected. For live per-port link state, see the interface picker in Configure Device Network. When configuring ports, use the MAC address shown here as the port selector rather than the interface name, which the OS can reassign across reboots and updates.
A bolt icon marks each Power over Ethernet port. Expand a port to see its power draw and state, or read the total for all PoE ports in the panel header.
If a port is set to DHCP Server, the panel also lists the leases the device has handed out on that port, with each client's IP, MAC, hostname, expiry, reachability, and whether it looks like a GigE camera.
The panel appears once the device reports network telemetry. Cloud network configuration additionally requires a current device agent, which updates automatically when the device reboots.