About
Roboflow's Model Monitoring dashboard gives you unparalleled visibility into your models, from prototyping, all the way through production. With Model Monitoring, you can view high-level statistics to get insight into how your models are performing over time, or even view individual inference requests, to see how your models perform on edge cases.
Model Monitoring will get deprecated and replaced by Vision Events. See Vision Events documentation for additional information.
Web App
Accessing Model Monitoring
Model Monitoring is a sub-tab on the Models page. To access it, open the "Models" dropdown in your workspace navigation bar and select "Model Monitoring", or navigate to the "Model Monitoring" tab on the Models page directly.
Workspace Dashboard
Immediately, you will see three statistics pertaining to your models:
- Total requests: The total number of inferences made to all models in your workspace
- Average confidence: The average confidence across all predictions made by your models.
- Average inference time: The average inference time across all inferences (The time in seconds it took to produce the predictions including image preprocessing)

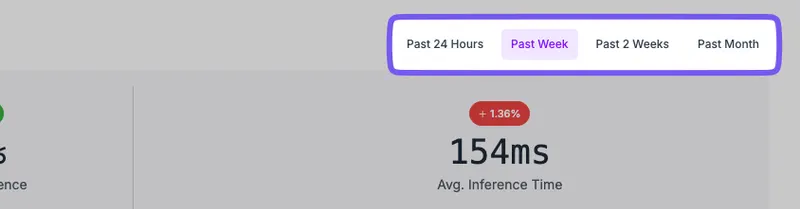
The % change values are based on the current period vs the previous period. By default, these statistics will show your data for the last week. However, you can modify the time range using the buttons on top of the statistics.
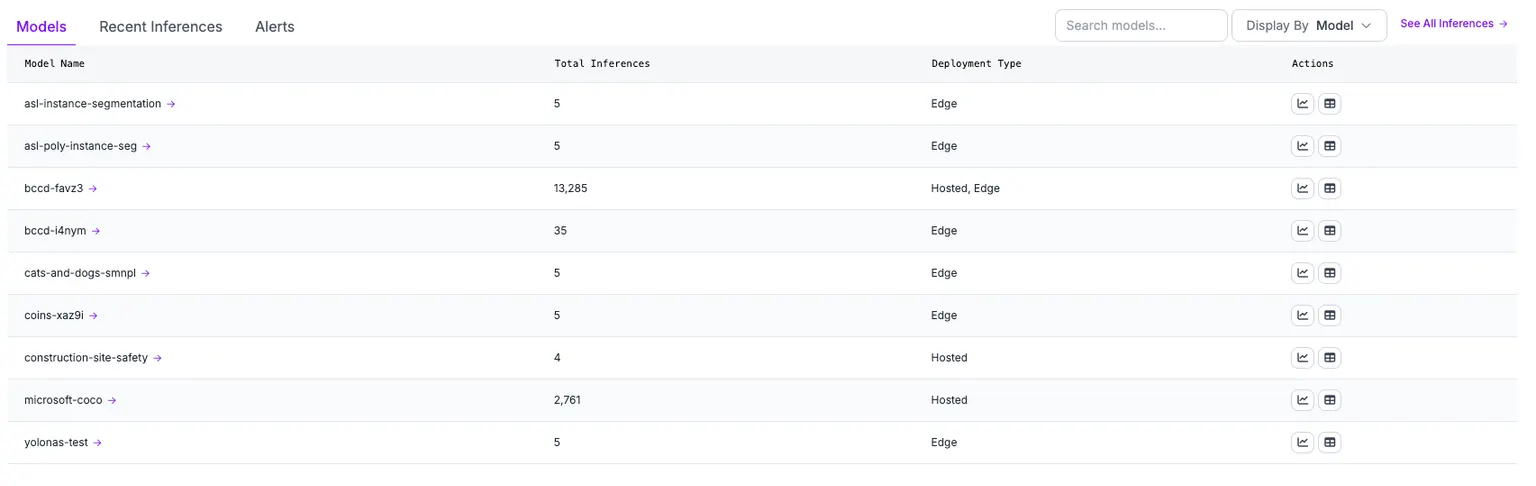
The Models table shows all models that have inferences on them and clicking on them will take you to the Model Dashboard.
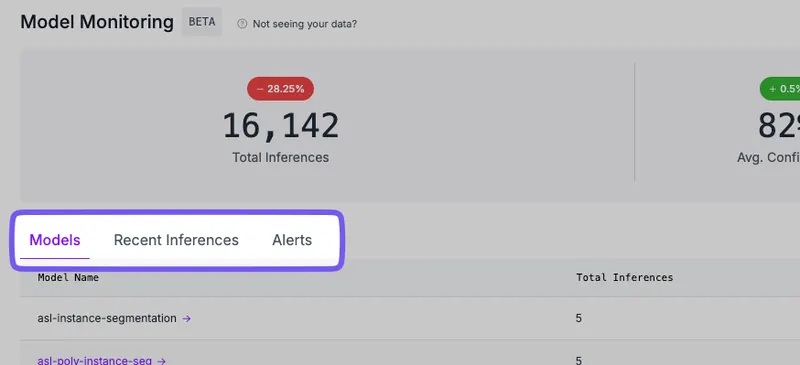
You can also access tabs for viewing Recent Inferences (across all models) and setting Alerts.
Model Dashboard
Under the Models tab, you can select a specific model to view its data. There, you'll see the same statistics as the Workspace Overview, but specific to one model.
Here, in addition to the statistics, you can view the number of detections for each class in the model, and see its distribution with respect to other classes.
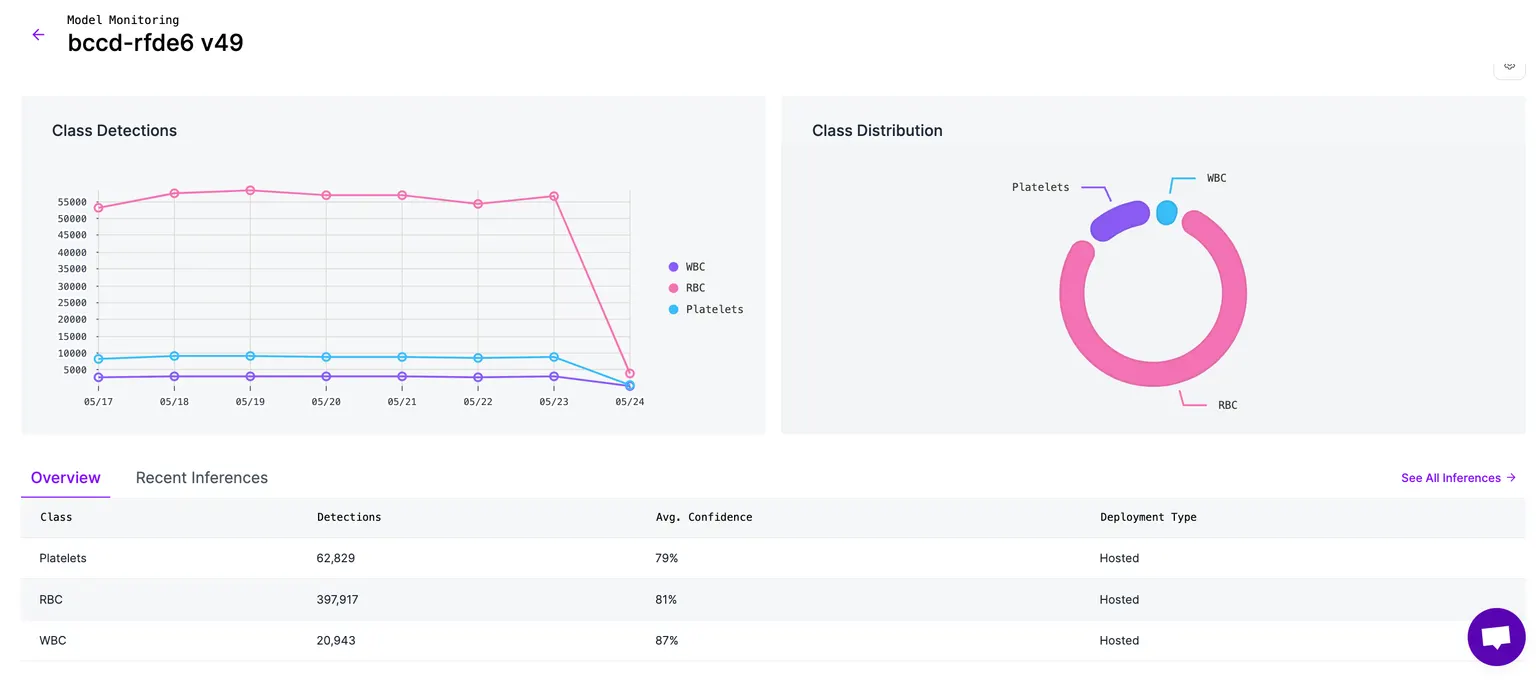
Clicking on the "See All Inferences" button at the top right of the table will navigate you to the Inferences Table.
Inferences Table
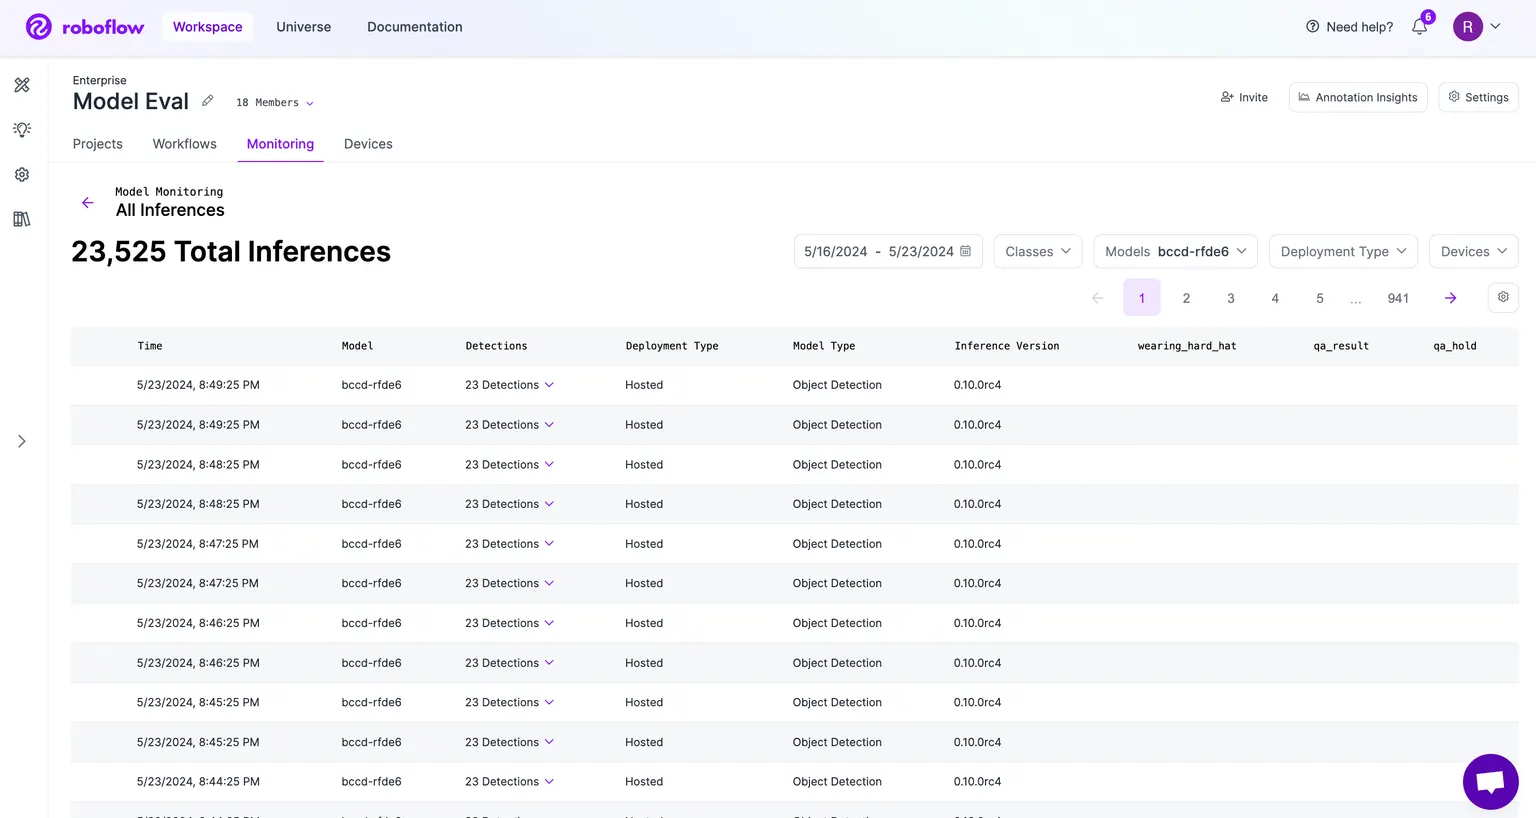
Here, you can see all the prediction results for your model. In addition, you will also see any custom metadata that was added to your inferences. To view a subset of your inferences, you can use the filters on the top-right of the table.
Inference Details
From the Inferences Table, you have the ability to drill down into a specific inference and see more details. Let's break it down in the order shown in this image:
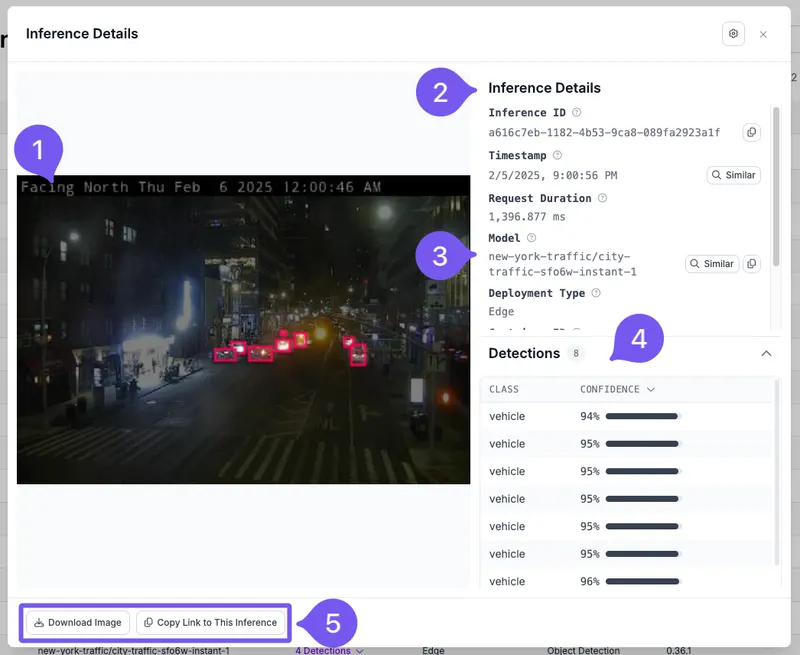
- Image: Here, you can see the image that was inferred. Note: This isn't enabled by default. See Enabling Inference Images
- Inference Details: On this panel, you can view all the details and properties about your inference request. All available fields are shown by default, but if you want to hide some, you can click the "Cog" icon in the top right corner to hide fields. (This setting will persist on your browser)
- On some fields, if available, there will be an option to search for inferences based on that field. On the highlighted example, it will search for inferences from the same model.
- Detections: This collapsable pane shows a list of detections received from that inference. You can click on the "Class" and "Confidence" table headers to choose the sort order of the table.
- Download & Link buttons: Here, you can download the image associated with the inference or copy a link to this Inference Details for later reference.
Enabling Inference Images
Images saved by Active Learning or Dataset Upload will count the same as uploading an image to your project. Credit, limit or quota usage may apply according to your plan type.
There are two ways to enable inference images to show up in Model Monitoring:
- Roboflow Dataset Upload block: In Workflows, you can add a "Roboflow Dataset Upload" block. Once you hook up the predictions and prediction image, it will show up in Model Monitoring.

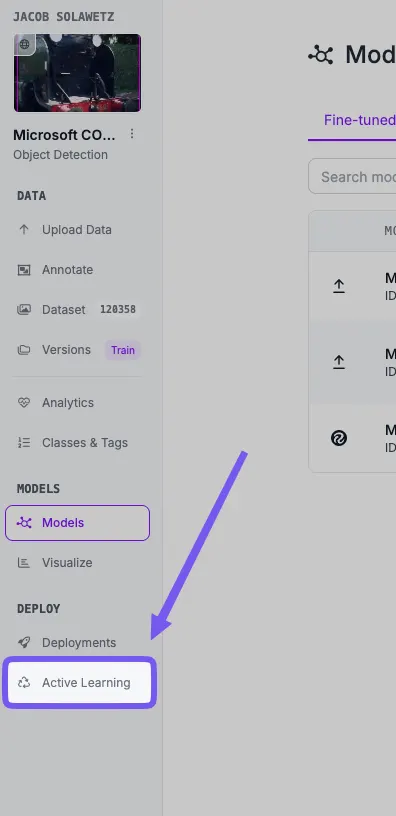
- Active Learning: You can configure Active Learning rules from your Project to automatically collect production inference images.
Alerting
You and other members of your team can subscribe to real-time alerts when issues or anomalies occur with your model. For example, if the confidence of your model suddenly decreases, or your Inference Server goes down, and your model stops running, your team will receive an email notification.
See more info on the Alerting page:
AlertingSet up Model Monitoring alerts to get notified when inference metrics cross a threshold you define.Custom Metadata
To attach additional metadata to an inference, you can use Model Monitoring's custom metadata feature. Using custom metadata, you can add information to an inference such as the location of where the image was taken, the expected value of the prediction, and so on. Your custom metadata will show up in the "Recent Inferences" and "All Inferences" views.
To attach custom metadata to an inference result, please see the Custom Metadata API documentation.
Model Monitoring API
For automation and integration into external systems, you can pull Model Monitoring statistics using our API for model monitoring.
Supported Deployments
Model Monitoring supports inference requests made using Roboflow's Cloud API or the Roboflow Inference Server, granted the Inference Server has internet access. This includes edge deployments which use Roboflow's License Server.
HTTP API
Retrieve Statistics About Deployed Models in a Workspace
You can retrieve Model Monitoring statistics using the Model Monitoring API. This endpoint currently accepts 3 query params (in addition to the api_key):
- startTime: DateTime string in the format "YYYY-MM-DD HH:flag_mm:ss". If empty, will default to 24 hours from the time of the request
- endTime: DateTime string in the format "YYYY-MM-DD HH:flag_mm:ss". If empty, will default to the current time of the request
- modelNames: A string of comma separate model names, i.e. "?modelNames=license-plate-detector,truck-detector"
Stats
GET /:workspace/inference-stats
Example Request:
curl --location --request GET 'https://api.roboflow.com/${WORKSPACE}/inference-stats?api_key=$ROBOFLOW_API_KEY&startTime=&endTime=' \Example Response:
{
    "num_inferences": 120,
    "prev_num_inferences": 290,
    "num_errors": 0,
    "prev_num_errors": 0,
    "avg_confidence": 0.92541713388321,
    "prev_avg_confidence": 0.8610920182589827,
    "avg_response_time": 0.16464362986438943,
    "prev_avg_response_time": 0.043521592255159045,
    "inference_stats": [
        {
            "model_name": "cards-3z9gn",
            "predicted_class": "Playingcards",
            "num_inferences": 106,
            "prev_num_inferences": 190,
            "num_errors": null,
            "prev_num_errors": null,
            "avg_confidence": 0.931105958703923,
            "prev_avg_confidence": 0.935741652940449,
            "avg_response_time": 0.176652773857811,
            "prev_avg_response_time": 0.05487422056841488,
            "median_confidence": 0.9268901944160461,
            "class_count": 211,
            "deployment_types": "hosted",
            "inference_server_versions": "0.15.3,0.16.0",
            "model_num_inferences": 107,
            "prev_model_num_inferences": 190
        },
        {
            "model_name": "cards-3z9gn",
            "predicted_class": "",
            "num_inferences": 1,
            "prev_num_inferences": null,
            "num_errors": null,
            "prev_num_errors": null,
            "avg_confidence": 0,
            "prev_avg_confidence": null,
            "avg_response_time": 0,
            "prev_avg_response_time": null,
            "median_confidence": 0,
            "class_count": 1,
            "deployment_types": "hosted",
            "inference_server_versions": "0.16.0",
            "model_num_inferences": 107,
            "prev_model_num_inferences": null
        },
        {
            "model_name": "hard-hat-sample-8j2w3",
            "predicted_class": "head",
            "num_inferences": null,
            "prev_num_inferences": 100,
            "num_errors": null,
            "prev_num_errors": null,
            "avg_confidence": null,
            "prev_avg_confidence": 0.6933842897415161,
            "avg_response_time": null,
            "prev_avg_response_time": 0.021951598459972955,
            "median_confidence": null,
            "class_count": null,
            "deployment_types": "hosted",
            "inference_server_versions": "0.15.1",
            "model_num_inferences": null,
            "prev_model_num_inferences": 100
        },
        {
            "model_name": "hard-hat-sample-8j2w3",
            "predicted_class": "helmet",
            "num_inferences": null,
            "prev_num_inferences": 100,
            "num_errors": null,
            "prev_num_errors": null,
            "avg_confidence": null,
            "prev_avg_confidence": 0.7451311349868774,
            "avg_response_time": null,
            "prev_avg_response_time": 0.021951598459972955,
            "median_confidence": null,
            "class_count": null,
            "deployment_types": "hosted",
            "inference_server_versions": "0.15.1",
            "model_num_inferences": null,
            "prev_model_num_inferences": 100
        },
        {
            "model_name": "coco",
            "predicted_class": "car",
            "num_inferences": 11,
            "prev_num_inferences": null,
            "num_errors": null,
            "prev_num_errors": null,
            "avg_confidence": 0.91790372133255,
            "prev_avg_confidence": null,
            "avg_response_time": 0.0647244118180817,
            "prev_avg_response_time": null,
            "median_confidence": 0.91790372133255,
            "class_count": 22,
            "deployment_types": "hosted",
            "inference_server_versions": "0.15.3",
            "model_num_inferences": 11,
            "prev_model_num_inferences": null
        },
        {
            "model_name": "license-plate-recognition-rxg4e",
            "predicted_class": "License_Plate",
            "num_inferences": 2,
            "prev_num_inferences": null,
            "num_errors": null,
            "prev_num_errors": null,
            "avg_confidence": 0.8706022202968597,
            "prev_avg_confidence": null,
            "avg_response_time": 0.07911215199999333,
            "prev_avg_response_time": null,
            "median_confidence": 0.8706022202968597,
            "class_count": 2,
            "deployment_types": "hosted",
            "inference_server_versions": "0.15.3",
            "model_num_inferences": 2,
            "prev_model_num_inferences": null
        }
    ]
}
Attach Metadata to an Inference
You can attach a custom metadata value to each inference result and view it in the Model Monitoring dashboard.
Applications
Custom metadata has a number of applications, from tagging data to make it easier to find and organize, to adding additional context to an inference result. For example, let's suppose you're an automotive manufacturer with three factories across the United States. A few things you might consider adding to your inference results include location, which production-line an image was taken on, whether a certain operation passed or failed, and the expected result of the inference (like color=blue).
Create Custom Metadata
POST /:workspace/inference-stats/metadata
Attaches additional data to an inference result that will be displayed in the Model Monitoring dashboard.
When you make an inference request with Roboflow's Inference Container or Serverless Cloud API, you will receive an inference_id in the response. Using this ID, you can add it to the inference_ids array as shown below to attach your metadata to it. The field_name is a name for the property, and the value is the value.
For example, if I want to attach a geographic location to my inference results, I would set the field_name to "location" and the value would be a location like "united_states".
Note: The values for field_name and field_value are completely user-defined. Be sure to keep the formatting consistent, including the letter case. For example field_name: "my_location" and field_name: "My_location" will be treated as two separate metadata values.
Example Request:
curl --location --request POST 'https://api.roboflow.com/${WORKSPACE}/inference-stats/metadata' \
--header 'Content-Type: application/json' \
--data-raw '{
    "api_key": "YOUR_API_KEY",
    "data": [
        {
            "inference_ids": ["a12a19a9-a933-44c9-970c-a55ea03bb453"],
            "field_name": "camera_location",
            "field_value": "canada"
        },
        {
            "inference_ids": ["accf0af9-bdf0-4b22-8106-6988d4cada5a"],
            "field_name": "camera_location",
            "field_value": "emea"
        }
    ]
}'
Headers:
| Name | Value |
|---|---|
| Content-Type | application/json |
Body:
| Name | Type | Description |
|---|---|---|
data | Array<Metadata> | <p>{</p><p>"inference_ids": Array<string>;</p><p>"field_name": string;</p><p>"field_value": string;</p><p>}</p> |
Response:
{
  "status": "ok"
}{
"error": "Invalid request"
}Example Using Python:
import requests
from inference_sdk import InferenceHTTPClient

#### Change these
api_key = "YOUR_API_KEY"
workspace = "YOUR_WORKSPACE_ID"

#### Default values
field_name = "test_field"
field_value = "test_value"
model_id = "coco/24"
image_path = "https://cdn.britannica.com/79/232779-050-6B0411D7/German-Shepherd-dog-Alsatian.jpg"
api_url = "https://serverless.roboflow.com"

#### Initialize the client
print("Initializing the InferenceHTTPClient...")
client = InferenceHTTPClient(api_url=api_url, api_key=api_key)

#### Run the inference
result = client.infer(image_path, model_id=model_id)
print("Result:", result)

#### Extract the inference ID from the result
inference_id = result.get('inference_id')
if inference_id:
    print("Inference ID:", inference_id)
else:
    raise ValueError("Inference ID not found in the response.")

url = f"https://api.roboflow.com/{workspace}/inference-stats/metadata"

#### Set the headers and data for the POST request
headers = {
    "Content-Type": "application/json"
}
data = {
    "api_key": api_key,
    "data": [
        {
            "inference_ids": [inference_id],
            "field_name": field_name,
            "field_value": field_value
        }
    ]
}

#### Make the POST request to attach the custom metadata
response = requests.post(url, headers=headers, json=data)

#### Check the response status
if response.status_code == 200:
    print("Custom metadata attached successfully:", response.json())
else:
    print("Failed to attach custom metadata:", response.text)