About
Model evaluations show:
- A production metrics explorer, which helps you find the optimal confidence threshold at which to run your model;
- Model improvement recommendations, which provide suggestions on how you can increase the accuracy of your model;
- Performance by class, which shows how well your model identifies different classes;
- A confusion matrix, which you can use to find specific classes on which your model thrives and struggles, and;
- An interactive vector explorer which lets you identify clusters of images where your model does well or poorly;
You can use model evaluation to identify areas of improvement for your model.
Model evaluations are automatically run for all versioned models trained on, or uploaded to Roboflow by paid users. It may take several minutes for an evaluation to run for a dataset of a few hundred images, and several hours for large datasets with thousands or more images.
Supported Project Types
Model evaluation supports Object Detection, Instance Segmentation, Classification, and Semantic Segmentation projects.
For Semantic Segmentation, the headline metric is mIoU (mean Intersection-over-Union) instead of mAP. All metrics (precision, recall, F1) are computed at the pixel level rather than per-instance. The per-class breakdown shows IoU, precision, recall, F1, and an optimal confidence threshold for each class. Confusion matrix values represent pixel counts rather than object counts.
Web App
Open Model Evaluation
To find the confusion matrix and vector explorer for your model, open any trained model in your project. Then, click the "View Evaluation" button:
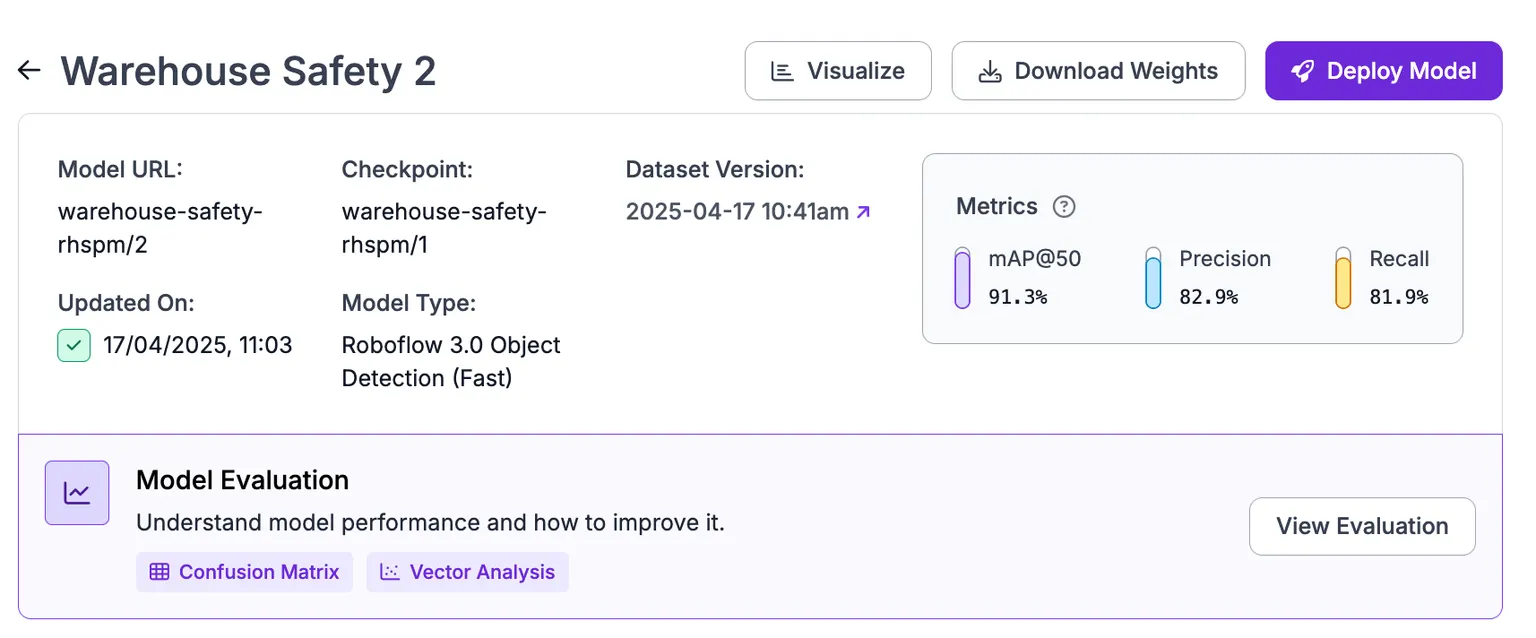
A window will open where you can view your confusion matrix and vector analysis.
Production Metrics Explorer
The production metrics explorer shows the Precision, Recall, and F1 score for your model at all possible confidence thresholds. This information is presented on a graph.
Using these statistics, the production metrics explorer will recommend an "optimal confidence". This is the threshold that will give you the best Precision/Recall/F1 Score trade-off.
Once model evaluation completes, the optimal confidence threshold is automatically applied as the default for your model's inference requests. If per-class thresholds are available, those are applied too, with the global threshold used as a fallback for any class without its own value.
You can still override the confidence threshold on any individual inference request by passing the confidence parameter explicitly.
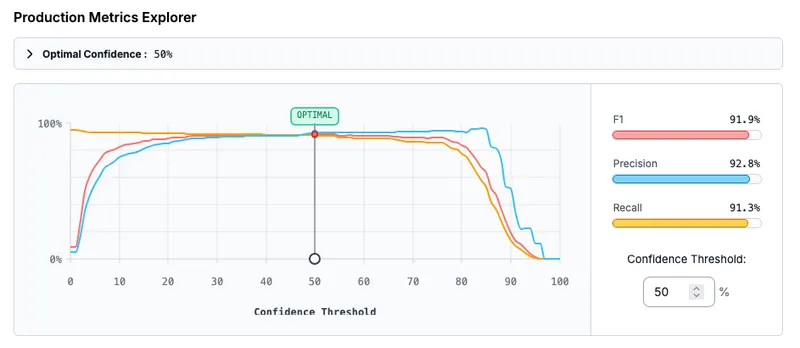
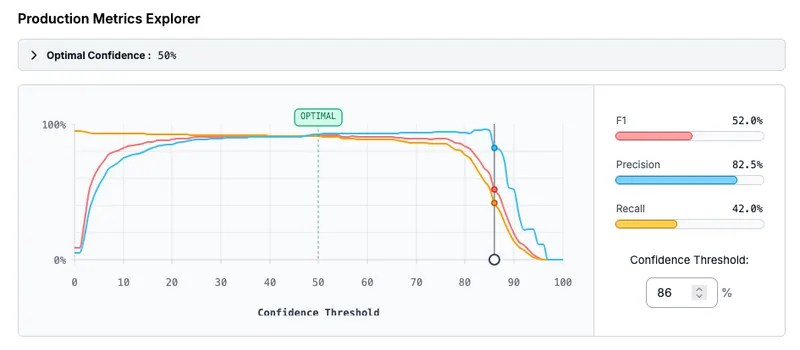
You can drag the slider to see the F1/Precision/Recall values at difference confidence thresholds:
Model Improvement Recommendations
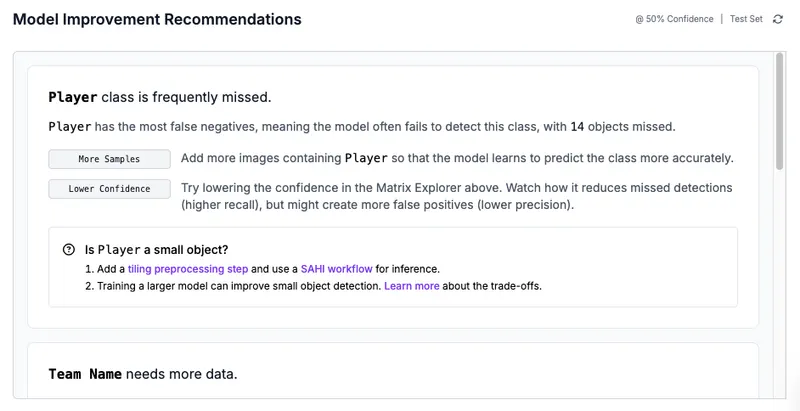
The model improvement recommendations section of your model evaluation lists suggestions on how you can increase the accuracy of your model. These improvements are based on the results of the confusion matrix calculated with your model. (See more information on your confusion matrix later on this page).
The model improvement recommendations feature can make suggestions related to:
- How to improve a model that predicts many false negatives.
- How to improve a model that predicts many false positives.
- What classes are often confused (mis-identified).
- What classes need more data to improve accuracy.
- When a test or validation set may be too small.
- And more.
Performance by Class
The performance by class chart shows how many correct predictions, misclassifications, false negatives, and false positives there are across all classes in your dataset.
You can use this information to see, at a glance, which classes your model can identify well and the classes our model struggles to identify.
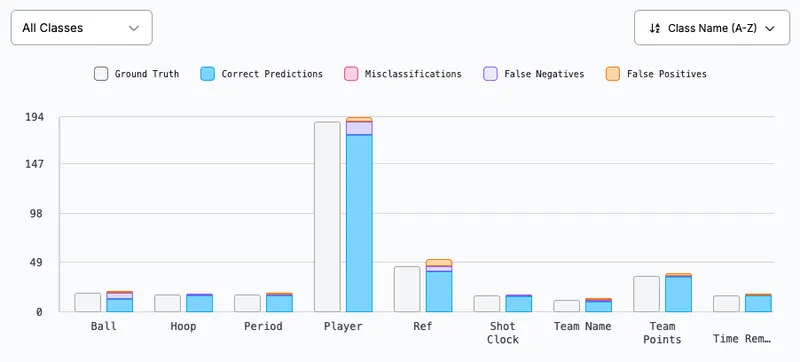
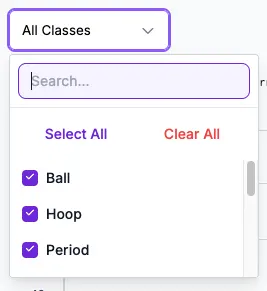
If your dataset has a large number of classes, you can focus the chart on specific classes by opening the "All Classes" dropdown and selecting the classes you want to highlight:
You can also see how this chart changes at different confidence thresholds by moving the Confidence Threshold slider:
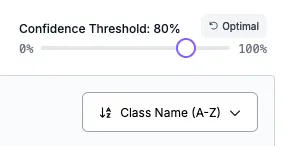
By default, this chart will use the optimal confidence threshold we recommend.
Confusion Matrix
Your confusion matrix shows how well your model performs on different classes.
Your confusion matrix is calculated by running images from your test and validation sets with your trained model. The results from your model are then compared with the "ground truth" from your dataset annotations.
With the confusion matrix tool, you can identify:
- Classes where your model performs well.
- Classes where your model identifies the wrong class for an object (false positives).
- Instances where your model identifies an object where none is present (false negatives).
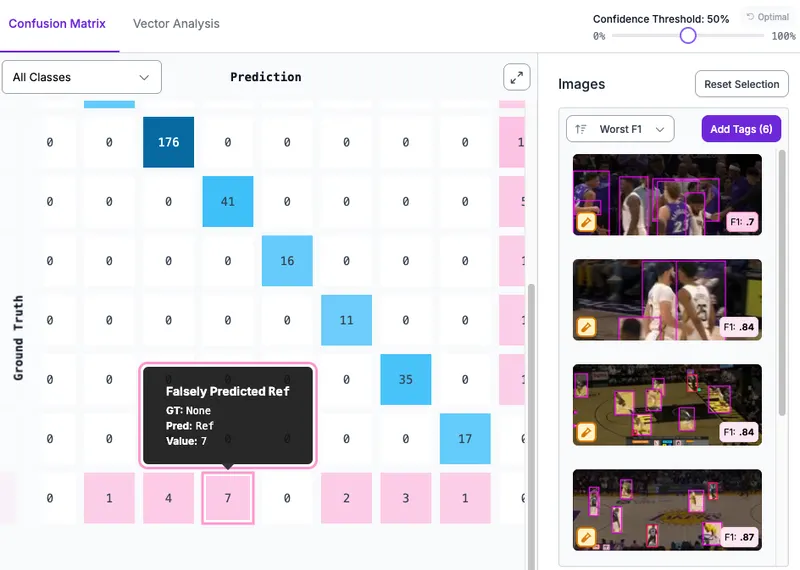
Here is an example confusion matrix:
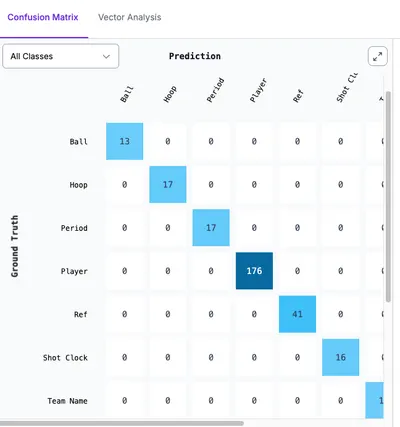
If your model detects many classes, scroll bars will appear that let you navigate your confusion matrix.
By default, the confusion matrix shows how your model performs when run at the optimal threshold calculated for your model.
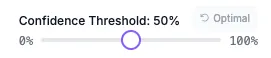
You can adjust the confidence threshold using the Confidence Threshold slider. Your confusion matrix, precision, and recall will update as you configure the slider:
You can click on each box in the confusion matrix to see what images appear in the corresponding category.
For example, you can click any box in the "False Positive" column to identify images where an object was identified where one was not present in your ground truth data.
You can click on an individual image to enter an interactive view where you can toggle between the ground truth (your annotations) and the model predictions:
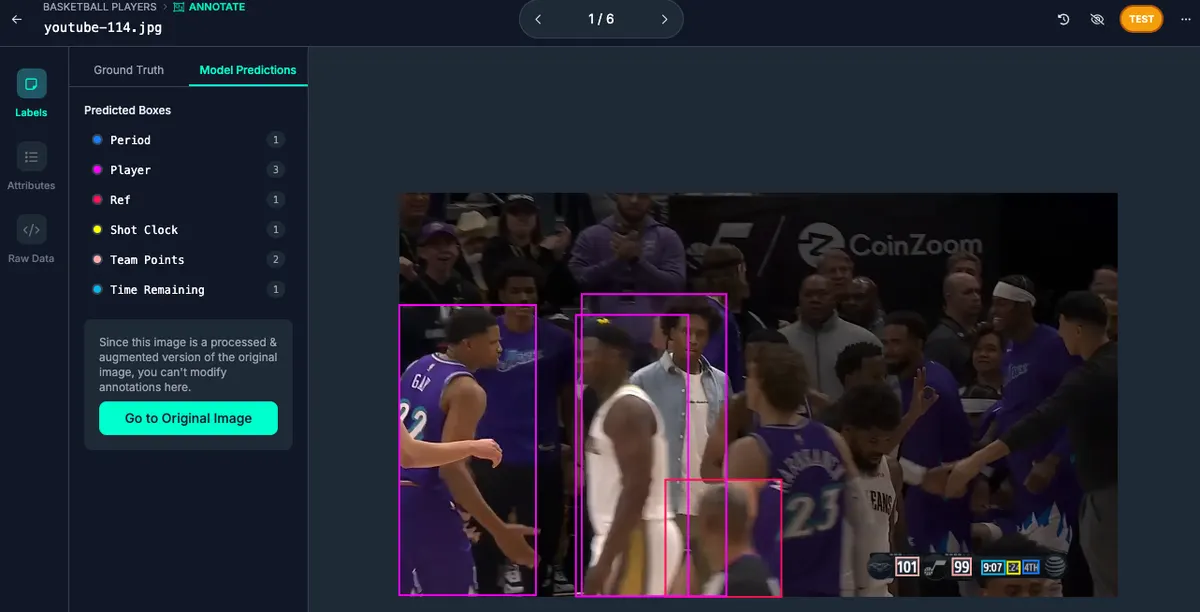
Click "Ground Truth" to see your annotations and "Model Predictions" to see what your model returned.
HTTP API
A model evaluation captures how a model performs on a Version's test split - per-class metrics, confidence-threshold curves, image-embedding clustering, per-image predictions, and improvement recommendations. For object detection and instance segmentation the headline metric is mAP; for semantic segmentation it is mIoU. Evaluations are produced automatically when a training completes and can be re-triggered manually from the app.
The Model Evaluations API lets you read everything the app's evaluation page shows. Each panel in the UI maps to a dedicated endpoint:
- List model evaluations in a workspace
- Get one evaluation's metadata and headline metrics
- Get full per-split metric detail (mAP or mIoU)
- Get the confidence-threshold sweep and F1-optimal thresholds
- Get per-class performance for one split
- Get the confusion matrix
- Get the image-embedding clustering (vector analysis)
- Get per-image predictions
- Get model improvement recommendations
Authentication
All endpoints require an API key with the model-eval:read scope. Pass it as a query parameter or as a Bearer token in the Authorization header.
Common errors
| Status | Error code | When |
|---|---|---|
401 | unauthenticated | API key missing or invalid |
404 | model_eval_not_found | Evaluation does not exist or belongs to a different workspace |
409 | model_eval_not_done | Evaluation has not completed; the panel data is not yet available |
400 | invalid_confidence | confidence query parameter is not an integer in [0, 100] |
400 | invalid_split | split query parameter is not one of the allowed values for the endpoint |
List Model Evaluations
List the model evaluations in a workspace. Returns a lean projection - for headline metrics on a specific evaluation, follow up with Get a Model Evaluation.
https://api.roboflow.com/:workspace/model-evalscurl "https://api.roboflow.com/my-workspace/model-evals?api_key=$ROBOFLOW_API_KEY&status=done&limit=10"Query parameters
| Parameter | Type | Description |
|---|---|---|
project | string | Filter to a project by its URL slug (e.g. chess-pieces-fmhpz) |
version (alias versionId) | string | Filter to a specific version (e.g. "4") |
model (alias modelId) | string | Filter to evaluations of a specific model ID |
status | enum | One of running, done, failed. Unknown values return 400. |
limit | integer | Page size; default 50, max 200 |
At most one of project / version / model may be set per call (the most specific wins: model > version > project). Combinations are rejected with 400 invalid_filter_combination to keep the storage indices bounded.
Response
{
    "evals": [
        {
            "evalId": "huUF720inUcymARwqAGK",
            "status": "done",
            "project": "chess-pieces-fmhpz",
            "versionId": "4",
            "modelId": null,
            "createdAt": "2026-04-27T20:04:10.904Z"
        }
    ]
}
project is the project's URL slug - the same identifier the REST API uses in URL paths (/:workspace/:project/...). To deep-link to the evaluation UI: https://app.roboflow.com/{workspace}/{project}/evaluation/{versionId}.
Get a Model Evaluation
Fetch a single model evaluation by its ID. For completed evaluations the response includes a summary object with headline metrics; running or failed evaluations return the lean shape only. Which headline metric is populated depends on the task type - mAP for detection-shaped tasks, mIoU for semantic segmentation.
https://api.roboflow.com/:workspace/model-evals/:evalIdcurl "https://api.roboflow.com/my-workspace/model-evals/huUF720inUcymARwqAGK?api_key=$ROBOFLOW_API_KEY"Response (done evaluation)
{
    "evalId": "huUF720inUcymARwqAGK",
    "status": "done",
    "project": "chess-pieces-fmhpz",
    "versionId": "4",
    "modelId": null,
    "createdAt": "2026-04-27T20:04:10.904Z",
    "summary": {
        "mAP": 0.9239650566041828,
        "mIoU": null,
        "precision": 0.85,
        "recall": 0.85
    }
}
Response (running or failed)
The same fields without the summary block.
{
    "evalId": "fNyWx6PC74rCc18IuZ3M",
    "status": "running",
    "project": "hard-hat-detection",
    "versionId": "1",
    "modelId": null,
    "createdAt": "2026-03-19T21:02:07.918Z"
}
Notes
mAPis mean Average Precision at IoU 0.5 (map50). It isnullfor non-detection evaluation tasks (e.g. classification, semantic segmentation).mIoUis the foreground macro mean Intersection-over-Union. It is populated only for semantic segmentation evaluations andnullotherwise.precisionandrecallare reported at the F1-optimal confidence threshold for the test split.evalIdis the same identifier embedded in every panel response - themodelEvals.getpayload is structurally a superset of any panel payload, so asummary-augmentedmodelEvals.getand agetMapResultsresponse can be rendered through the same client code path.projectis the project's URL slug - the same identifier the REST API uses in URL paths. To deep-link to the evaluation UI:https://app.roboflow.com/{workspace}/{project}/evaluation/{versionId}.projectisnullif the project has been deleted.
Map Results
Returns the primary metric detail for the evaluation. The response shape depends on the task type:
- Object detection / instance segmentation - mAP at IoU 0.5 / 0.5-0.95 / 0.75 per split, broken down by object size and per class.
- Semantic segmentation - mIoU, precision, recall, F1 (pixel-level) per split, with per-class IoU and optimal confidence thresholds.
The taskType field in the response indicates which shape to expect: "object-detection-like" or "semantic-segmentation".
This is the data the metrics per split panel in the app reads.
https://api.roboflow.com/:workspace/model-evals/:evalId/map-resultscurl "https://api.roboflow.com/my-workspace/model-evals/$EVAL_ID/map-results?api_key=$ROBOFLOW_API_KEY"Response (object detection / instance segmentation)
{
    "taskType": "object-detection-like",
    "splits": {
        "test": {
            "map50": 0.9239650566041828,
            "map50_95": 0.7555258345429926,
            "map75": 0.9239650566041828,
            "byObjectSize": {
                "small": {
                    "map50": 0.9038189533239035,
                    "map50_95": 0.6478143732740621,
                    "map75": 0.9038189533239035
                },
                "medium": {
                    "map50": 0.9913366336633663,
                    "map50_95": 0.8572608399609195,
                    "map75": 0.9913366336633663
                },
                "large": null
            },
            "perClass": {
                "Car-rims": {
                    "map50": 0.9239650566041828,
                    "map50_95": 0.7555258345429926,
                    "map75": 0.9239650566041828,
                    "byObjectSize": {
                        "small": { "map50": 0.9, "map50_95": 0.65, "map75": 0.85 },
                        "medium": { "map50": 0.99, "map50_95": 0.85, "map75": 0.99 },
                        "large": null
                    }
                }
            }
        },
        "valid": { "...": "same shape" },
        "train": { "...": "same shape" }
    }
}
Response (semantic segmentation)
{
    "taskType": "semantic-segmentation",
    "splits": {
        "test": {
            "miou": 0.816,
            "precision": 0.938,
            "recall": 0.862,
            "f1": 0.898,
            "perClass": [
                {
                    "classID": 3,
                    "className": "multi",
                    "iou": 0.816,
                    "precision": 0.938,
                    "recall": 0.862,
                    "f1": 0.898,
                    "optimalThreshold": 0.0
                }
            ]
        },
        "valid": { "...": "same shape" },
        "train": { "...": "same shape" }
    }
}
Notes
- The
taskTypefield discriminates the response shape. Always check it before parsing split contents. - Detection:
map50_95is mAP averaged over IoU thresholds from 0.5 to 0.95 in steps of 0.05 (the COCO standard). Object-size buckets arenullwhen the split contains no instances of that size. Per-class entries appear underperClass, keyed by class name. - Semantic segmentation: All metrics are pixel-level macro means over foreground classes (background excluded).
miouis the mean Intersection-over-Union.optimalThresholdis the per-class F1-optimal confidence threshold. A value of0.0is valid and means the model peaks at argmax.
Confidence Sweep
Returns per-confidence-threshold metric curves and the F1-optimal threshold per split (and per class). Useful for plotting precision/recall trade-offs and picking a deployment-time threshold.
This is the data the production metrics explorer panel in the app reads.
https://api.roboflow.com/:workspace/model-evals/:evalId/confidence-sweepcurl "https://api.roboflow.com/my-workspace/model-evals/$EVAL_ID/confidence-sweep?api_key=$ROBOFLOW_API_KEY"Response
{
    "splits": {
        "test": {
            "perThreshold": {
                "0.00": { "precision": 0.02, "recall": 1.0,  "f1": 0.039 },
                "0.20": { "precision": 0.45, "recall": 0.92, "f1": 0.605 },
                "0.37": { "precision": 0.85, "recall": 0.85, "f1": 0.85 },
                "0.50": { "precision": 0.91, "recall": 0.78, "f1": 0.84 }
            },
            "optimalThreshold": 0.37,
            "optimalMetrics": {
                "precision": 0.85,
                "recall": 0.85,
                "f1": 0.85
            },
            "perClass": {
                "Car-rims": {
                    "perThreshold": { "0.37": { "precision": 0.85, "recall": 0.85, "f1": 0.85 } },
                    "optimalThreshold": 0.37,
                    "optimalMetrics": { "precision": 0.85, "recall": 0.85, "f1": 0.85 }
                }
            }
        },
        "valid": { "...": "same shape" },
        "train": { "...": "same shape" }
    }
}
Notes
perThresholdkeys are confidence thresholds as decimal strings, typically every0.01from0.00to0.99.optimalThresholdis the threshold that maximizes F1 for that split.- Per-class entries inside a split's
perClasshave the same shape minus the nestedperClass.
Performance by Class
Returns per-class headline metrics for one split. The response shape depends on the evaluation's task type:
- Object detection / instance segmentation - per-class
map50,map50_95,map75, precision, recall, F1, and optimal threshold. - Semantic segmentation - per-class
iou, precision, recall, F1, and optimal threshold (pixel-level).
The taskType field in the response indicates which shape to expect.
This is the data the performance by class panel in the app reads.
https://api.roboflow.com/:workspace/model-evals/:evalId/performance-by-classcurl "https://api.roboflow.com/my-workspace/model-evals/$EVAL_ID/performance-by-class?api_key=$ROBOFLOW_API_KEY&split=test"Query parameters
| Parameter | Type | Description |
|---|---|---|
split | enum | One of train, valid, test. Default test. all is not valid here - per-class metrics are not aggregable across splits. |
Response (object detection / instance segmentation)
{
    "taskType": "object-detection-like",
    "split": "test",
    "classes": [
        {
            "className": "Car-rims",
            "map50": 0.9239650566041828,
            "map50_95": 0.7555258345429926,
            "map75": 0.9239650566041828,
            "precision": 0.85,
            "recall": 0.85,
            "f1": 0.85,
            "optimalThreshold": 0.37
        },
        {
            "className": "music-note",
            "map50": null,
            "map50_95": null,
            "map75": null,
            "precision": 0,
            "recall": 0,
            "f1": 0,
            "optimalThreshold": 0.5
        }
    ]
}
Response (semantic segmentation)
{
    "taskType": "semantic-segmentation",
    "split": "test",
    "classes": [
        {
            "classID": 3,
            "className": "multi",
            "iou": 0.816,
            "precision": 0.938,
            "recall": 0.862,
            "f1": 0.898,
            "optimalThreshold": 0.0
        }
    ]
}
Notes
taskTypediscriminates the per-class field set. Detection classes includemap50/map50_95/map75; semantic segmentation classes includeiouandclassIDinstead.optimalThresholdis the per-class F1-optimal confidence threshold from the confidence sweep.precision,recall, andf1are reported at that per-class optimal threshold.- For detection, mAP fields are
nullwhen the split has no instances of that class. - For semantic segmentation, all metrics are pixel-level. An
optimalThresholdof0.0is valid.
Confusion Matrix
Returns the aggregated confusion matrix derived from per-image predictions. Each cell matrix[actual][predicted] is the count of instances where the ground-truth class was actual and the model predicted predicted. For semantic segmentation evaluations, values represent pixel counts rather than instance counts.
This is the data the confusion matrix panel in the app reads.
https://api.roboflow.com/:workspace/model-evals/:evalId/confusion-matrixcurl "https://api.roboflow.com/my-workspace/model-evals/$EVAL_ID/confusion-matrix?api_key=$ROBOFLOW_API_KEY&split=test"Query parameters
| Parameter | Type | Description |
|---|---|---|
split | enum | One of train, valid, test, or all. Default test. |
confidence | integer | Confidence-threshold percentage in [0, 100]. Defaults to the canonical file (typically 20). |
Response
{
    "split": "test",
    "confidenceThreshold": 0.2,
    "classes": ["Car-rims", "music-note", "background"],
    "matrix": [
        [20,  0, 0],
        [ 0,  0, 0],
        [80,  0, 0]
    ]
}
In the example above, at confidence threshold 0.2:
- All 20 instances of
Car-rimswere correctly classified (matrix[0][0] = 20) - The model produced 80 false positives - predicting
Car-rimswhen the actual class wasbackground(matrix[2][0] = 80) - The test split has no
music-noteinstances
Notes
confidenceselects which underlying per-confidence variant of the report to aggregate. Different thresholds yield different matrices.split=allaggregates raw counts across train, valid, and test.
Vector Analysis
Returns the image-embedding clustering output for the evaluation - UMAP-projected embeddings clustered by HDBSCAN, with per-cluster aggregate metrics. Useful for spotting groups of images where the model performs systematically better or worse.
This is the data the vector analysis panel in the app reads.
https://api.roboflow.com/:workspace/model-evals/:evalId/vector-analysiscurl "https://api.roboflow.com/my-workspace/model-evals/$EVAL_ID/vector-analysis?api_key=$ROBOFLOW_API_KEY"Query parameters
| Parameter | Type | Description |
|---|---|---|
confidence | integer | Confidence-threshold percentage in [0, 100] (defaults to the canonical report). |
Response
{
    "clustering": {
        "method": "hdbscan",
        "nClusters": 54,
        "metrics": {
            "noiseRatio": 0.078125,
            "silhouetteScore": 0.48925095796585083
        },
        "parameters": {
            "min_cluster_size": 2,
            "min_samples": 1,
            "cluster_selection_method": "eom",
            "metric": "euclidean"
        },
        "processingTimeSeconds": 8.36
    },
    "preprocessing": {
        "method": "umap",
        "originalDimensions": 768,
        "targetDimensions": 10,
        "nNeighbors": 30,
        "minDistance": 0.05
    },
    "clusters": [
        {
            "id": -1,
            "numImages": 15,
            "splitDistribution": { "train": 12, "valid": 2, "test": 1 },
            "metrics": {
                "f1Mean": 0.462,
                "f1Std": 0.219,
                "f1Min": 0.129,
                "f1Max": 0.8,
                "precisionMean": 0.330,
                "recallMean": 0.952
            },
            "sampleImages": ["img1.jpg", "img2.jpg"]
        },
        {
            "id": 0,
            "numImages": 3,
            "splitDistribution": { "train": 2, "valid": 1 },
            "metrics": {
                "f1Mean": 0.889,
                "f1Std": 0.157,
                "f1Min": 0.667,
                "f1Max": 1.0,
                "precisionMean": 1.0,
                "recallMean": 0.833
            },
            "sampleImages": ["img3.jpg", "img4.jpg", "img5.jpg"]
        }
    ]
}
Notes
- Cluster id
-1is the noise/unclustered bucket (HDBSCAN convention) - images that don't fit any dense region. precisionMeanandrecallMeanare averaged over all images in the cluster.- Per-image embeddings and cluster assignments are surfaced via Per-Image Predictions.
Per-Image Predictions
Returns per-image prediction records - TP/FP/FN counts, per-image precision/recall/F1, the image's cluster id and 2D embedding, and the raw confusion entries. Paginated.
This is the data the per-image predictions panel in the app reads.
https://api.roboflow.com/:workspace/model-evals/:evalId/image-predictionscurl "https://api.roboflow.com/my-workspace/model-evals/$EVAL_ID/image-predictions?api_key=$ROBOFLOW_API_KEY&split=test&limit=50"Query parameters
| Parameter | Type | Description |
|---|---|---|
split | enum | One of train, valid, test, or all. Default all. |
confidence | integer | Confidence-threshold percentage in [0, 100] (selects which per-confidence report variant to read). |
limit | integer | Page size; default 200, max 1000. |
offset | integer | Skip this many records before returning. Default 0. |
Response
{
    "split": "test",
    "confidenceThreshold": 0.2,
    "totalImages": 192,
    "offset": 0,
    "limit": 50,
    "images": [
        {
            "imageId": "1QKLCUsfAzFiCIb6YCJj",
            "imageName": "abc.jpg",
            "split": "test",
            "augmentations": 2,
            "cluster": {
                "id": 4,
                "embedding2D": [7.494518280029297, -5.143994331359863]
            },
            "stats": {
                "truePositives": 2,
                "falsePositives": 7,
                "falseNegatives": 0,
                "precision": 0.222,
                "recall": 1.0,
                "f1": 0.364
            },
            "confusion": [
                [0, 0, 2],
                [2, 0, 7]
            ]
        }
    ]
}
Notes
imageIdis the Roboflow source image id - useful for cross-referencing with other Roboflow APIs.confusionentries are[actualClassIdx, predictedClassIdx, count]triples; class indices reference the same array as Confusion Matrix'sclasses.embedding2Dis the UMAP-projected 2D coordinate used in the Vector Analysis plot.- Different
confidencevalues return different stats - predictions change with the threshold. Note that probing arbitraryconfidencevalues will only succeed for thresholds the eval pipeline materialized; unmaterialized variants return404 report_not_found. - Pagination cost: each page re-reads the full
model_eval_results.jsonfile from storage and slices it server-side. For evals with very largeimage_resultsarrays, prefer largerlimitvalues (up to1000) over many small pages to minimize the per-page fixed cost.
Recommendations
Returns model improvement recommendations generated from a completed evaluation - class-imbalance warnings, missed-detection patterns, and other actionable suggestions for what to add to your dataset or how to retrain.
This is the data the model improvement recommendations panel in the app reads.
This endpoint is read-only. Recommendations are generated as a side effect of training completion (or via the legacy in-app "Refresh Recommendations" action). If they have not yet been generated, the response is 200 {"generated": false} - note that this is not a 409 EVAL_NOT_DONE. The evaluation is done; it just doesn't have the optional recommendations side-output. Other panel endpoints (map-results, confidence-sweep, etc.) return 409 EVAL_NOT_DONE when their backing data is missing because that data is intrinsic to the evaluation; recommendations are not.
https://api.roboflow.com/:workspace/model-evals/:evalId/recommendationscurl "https://api.roboflow.com/my-workspace/model-evals/$EVAL_ID/recommendations?api_key=$ROBOFLOW_API_KEY"Response (recommendations available)
{
    "generated": true,
    "generatedAt": "2026-04-27T20:05:37.512Z",
    "recommendations": {
        "summary": {
            "confidenceThreshold": 37,
            "split": "test",
            "generatedAt": "2026-04-27T20:05:37.512Z",
            "count": 3,
            "f1": 0.85,
            "precision": 0.85,
            "recall": 0.85
        },
        "items": [
            {
                "id": "56bcd423-38ff-45f9-b3e0-662a71ce44e6",
                "type": "missed_detection",
                "analysis": {
                    "affected_class": "Car-rims",
                    "count": 3
                }
            },
            {
                "id": "150e49a8-3a61-479a-9e18-3eb751494a70",
                "type": "class_imbalance",
                "analysis": {
                    "affected_class": "Car-rims",
                    "current_count": 20,
                    "total_gt_instances": 20,
                    "median_count": 10
                }
            }
        ]
    }
}
Response (not yet generated)
{
    "generated": false
}
MCP Server
Connect your AI agent to the MCP Server and it can review how a model performed with these tools:
| Tool | Description |
|---|---|
model_evals_list | List model evaluations in the workspace. |
model_evals_get | Get the top-level summary for one evaluation. |
model_evals_get_map_results | Get per-split mAP results. |
model_evals_get_confusion_matrix | Get the confusion matrix. |
model_evals_get_performance_by_class | Get per-class performance metrics for one split. |
model_evals_get_recommendations | Get generated recommendations for the evaluation, if available. |